Help - Results
Multiple Sequence Alignments (MSA) of homologues proteins can provide us with at least to types of information; the first one is given by the conserved amino acids at certain positions, while the other is given by the inter-relationship between two or more position. Mutual information focuses on disentangling the later one. For example, mutations of essential residues in a protein sequence may occur, only if a compensatory mutation takes place elsewhere within the protein to preserve or restore activity. The extent of the mutual coevolutionary relationship between two positions in a protein family can be estimated using mutual information from information theory. Compensatory mutations are highly frequent and involve not only functional but also biophysical properties. Since evolutionary variations in the sequences are constrained by a number of requirements, such as maintenance of favourable interactions in direct residue-residue contacts, using the information contained in MSAs may be possible to predict residue pairs which are likely to be close to each other in the three-dimensional structure (Figure 1).
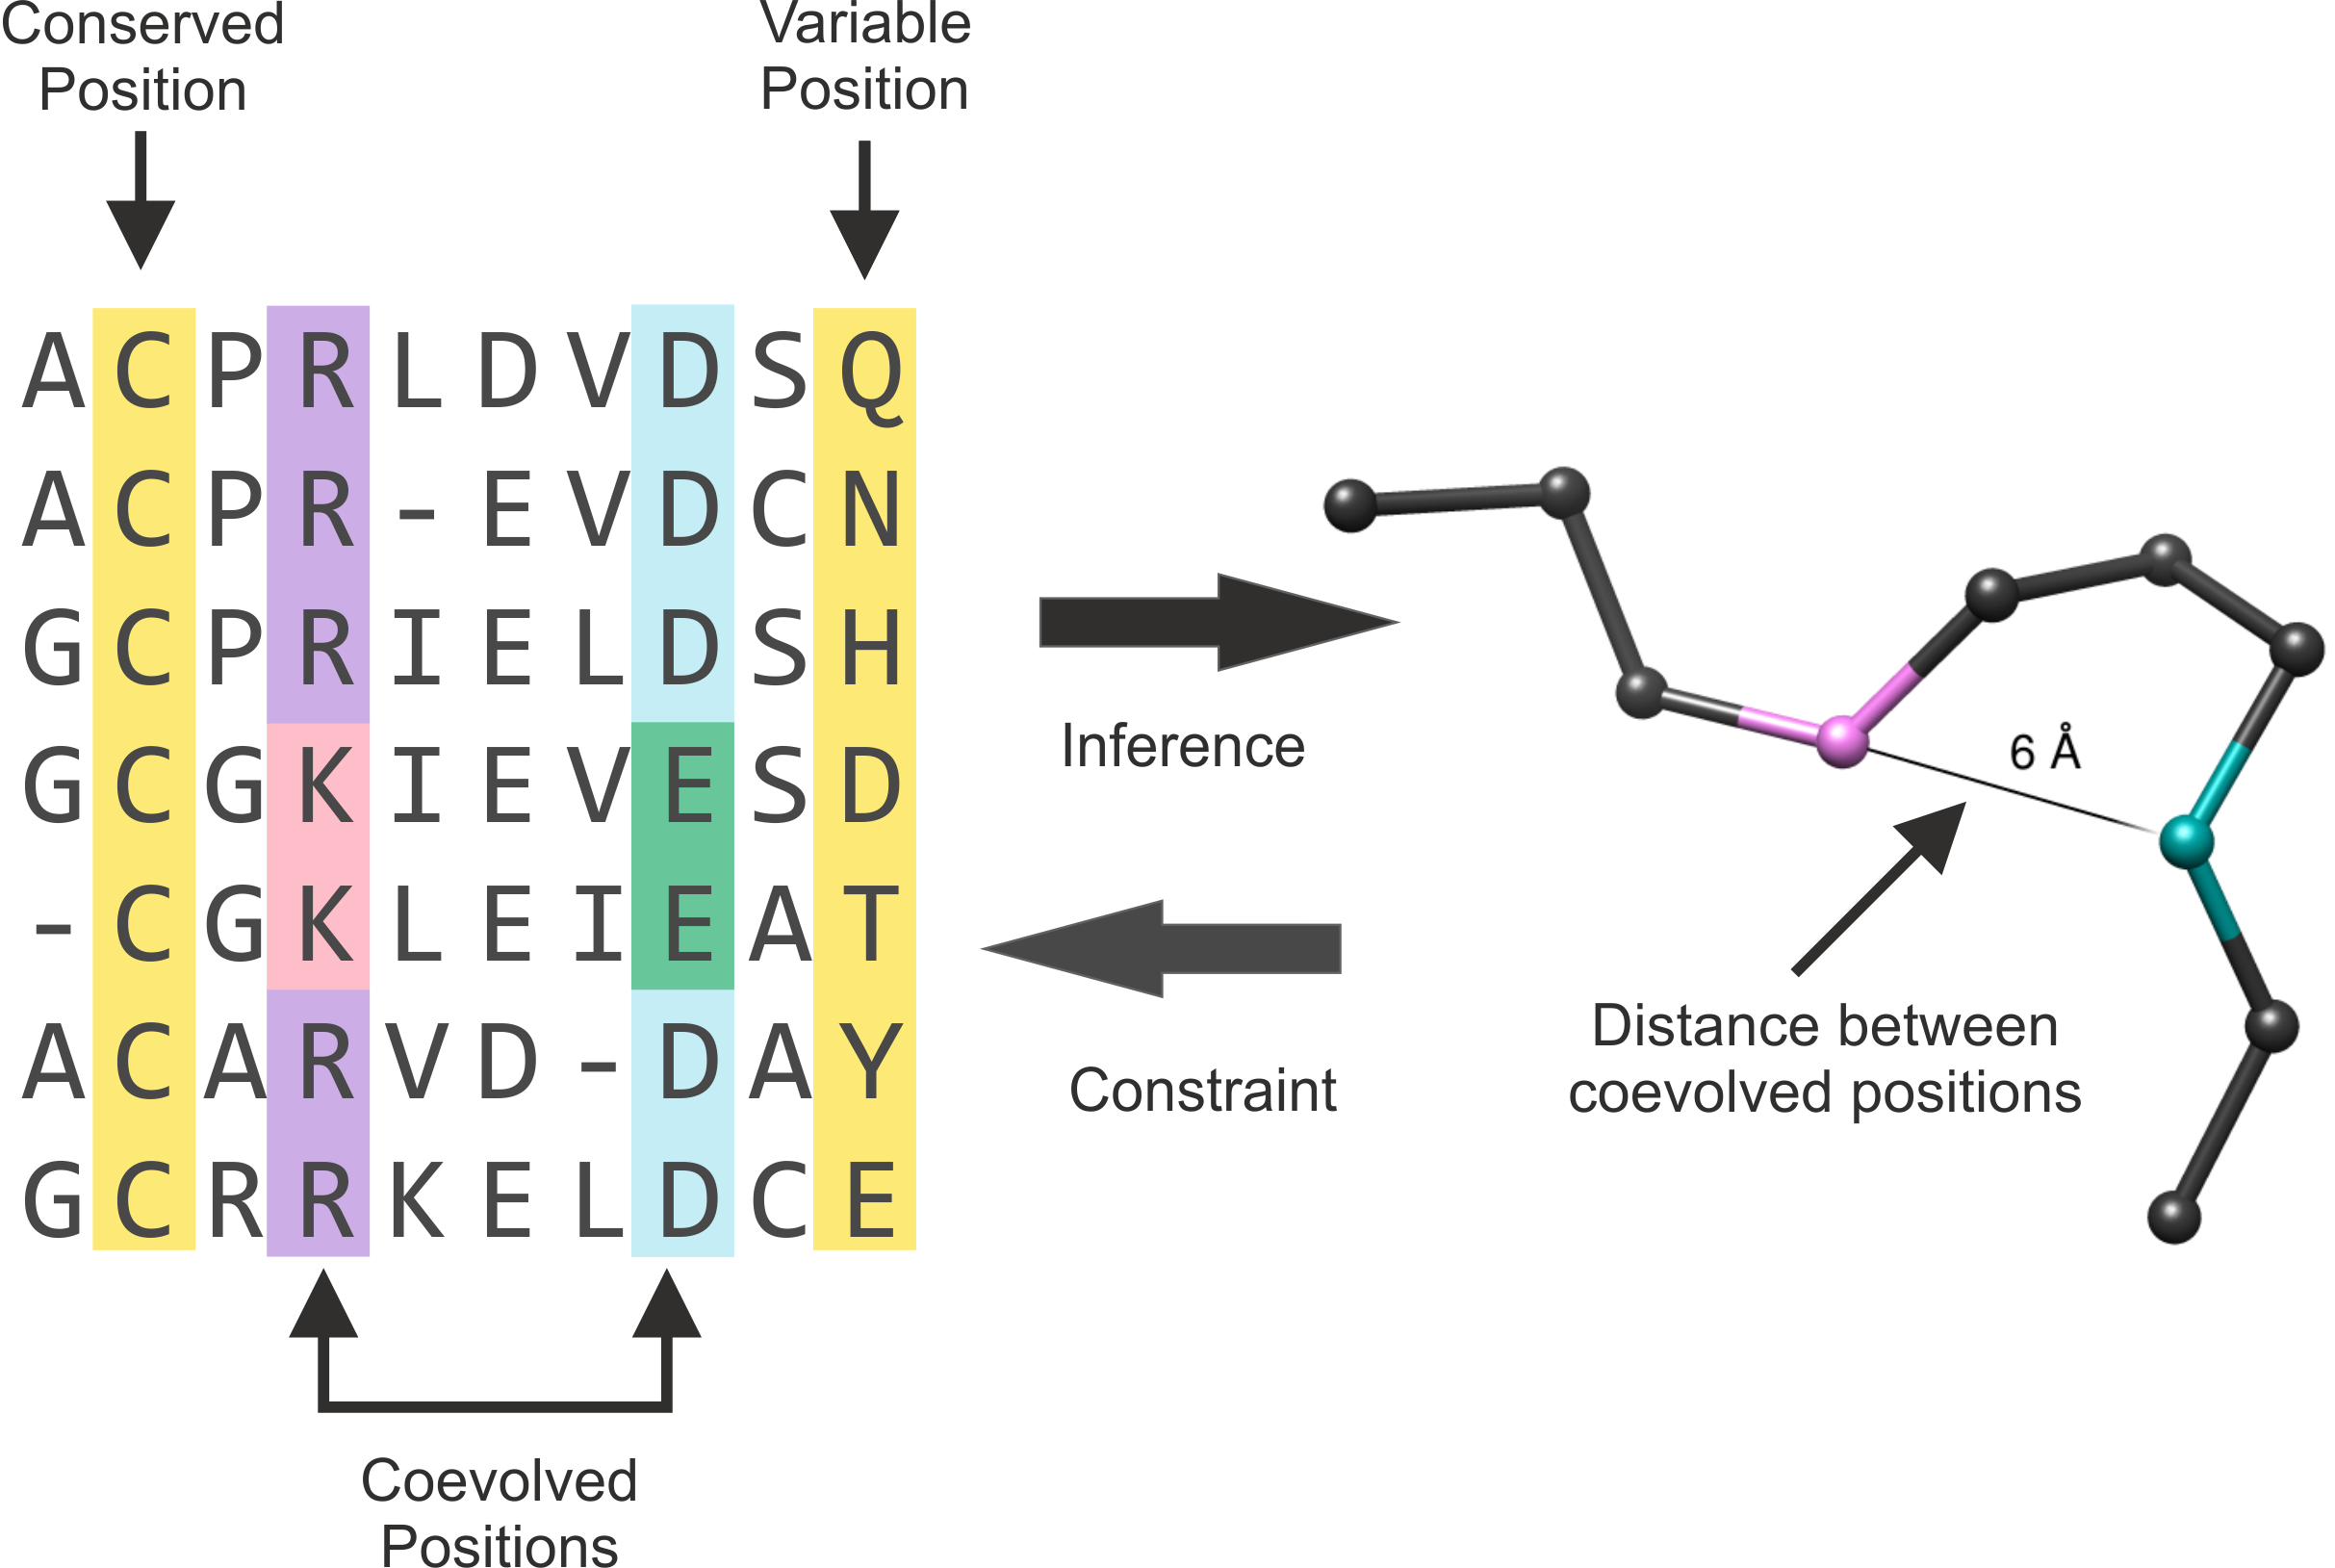 | |
Figure 1. Representation of a MSA and the alpha-carbon structure of one protein of the alignment. Conserved and variable positions are highlighted in yellow. The positions that coevolved are highlighted in purple and light blue. The residues within these positions where change occurred are shown in pink and green. The arrows (middle) represent the interrelation of coevolution and structural information. This Figure is an adaptation of Figure 1 of (Marks et al., 2011). |
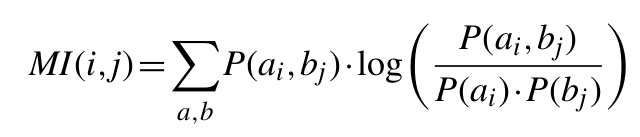
Mutual Information is a measurement of the uncertainty reduction for a MSA of homologous proteins. The MI between two positions (two columns in the MSA) reflects the extent to which knowing the amino acid at one position allows us to predict the amino acid identity at the other position. Given that any two positions in a MSA can be considered random such as variables x and y, the MI between them is given by equation 1:
Where P(ax, by) is the frequency of amino acid a occurring at position x and amino acid b occurring at position y in the same sequence, P(ax) is the frequency of amino acid a at position x and P(by) is the frequency of amino acid b at position y.
MI is thus a natural measure which makes it possible to identify sites of correlated and compensatory mutations in homologous proteins. However without the introduction of some correction factors, the MI yielded limited success. Distinguishing phylogenetic correlations from functional correlations was a challenge in coevolution detection and several corrections have been suggested to eliminate this noise inherent to the MI calculation [1]; [3]; Dutheil, 2011; Gouveia-Oliveira and Pedersen, 2007). One of the reasons for this noise is the fact that protein sequences are not independent, but have an inherent signal due to their evolutionary relationship (Gouveia-Oliveira & Pedersen, 2007).
Applied Corrections
A number of different approaches have been proposed to lower the high background signal imposed by phylogeny, thus enabling a more accurate identification of coevolving positions in protein
sequences. A simple way to account for shared ancestry is to measure the extent of correlation that would be expected solely due to phylogeny and stochasticity. This is achieved by randomization (also
known as bootstrap) procedures, which remove any functional correlation and therefore allow the user to get an empirical null distribution estimation of the correlation statistics.
Average Product Correction
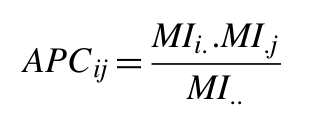
Another correction introduced, the average product correction (APC), defines a term (APC) and subtracts this value from MI giving a corrected MI (MIAPC) (Dunn et al., 2008) (Equations 2 and 3).
 | |
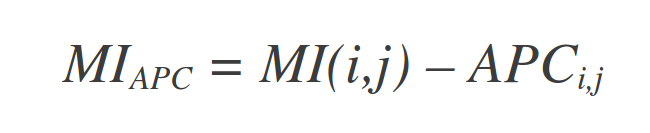 |
| Equations 2 (top) and 3 (bottom) |
Sequence Clustering
Furthermore, MSAs will often suffer from a high degree of unnatural sequence bias and redundancy, as a result of multiple-strain sequencing and biased selection of sequenced species. It was therefore expected that sequence clustering would improve the accuracy of the MI calculation. A Hobohm 1 algorithm (Hobohm et al., 992) is used to define sequence clusters, assigning to each sequence within a given cluster a weight corresponding to one divided by the number of sequences in that cluster.
Low count correction
It is also clear that for MSAs of limited size, a large fraction of the P(ax, by) values will be estimated from a very low number of observations, and their contribution to MI could be highly noisy. To deal with such low counts, we introduce a parameter λ. The initial value for the variable N(ax, by) = λ is set for all amino acid pairs, where N(ax, by) is the number of times that an amino acid pair (a, b) is observed at positions x and y. A range of λ values 0-0.2 in steps of 0.01 was tested achieving maximal performance for a value of λ equal to 0.05, but similar results are obtained in the range 0.025-0.075.
Z-score MI
Finally, to make the MI value comparable between families, a Z-score transformation is applied. The Z-score is then calculated as the number of standard deviations that the observed MI value falls above the mean value obtained from a hundred randomized MSAs.
So, whenever MI is mentioned we are referring to the Z-score MI corrected by APC, clustering and low count.
MI Circo is a sequential circular representation of the information obtained from the MSA. The labels in the outer portion of the image
indicate a position in the alignment and the aminoacid found in the reference sequence (if any). The colors for each position indicate conservation (highly conserverd positions
are in red, while less conserved ones are in blue) and which kind of secondary structure can be found in the structure provided -for the reference sequence- (if no structure was submitted, this information will not be displayed). Cumulative MI and Proximity MI are also displayed as histograms, facing outwards and inwards respectively.
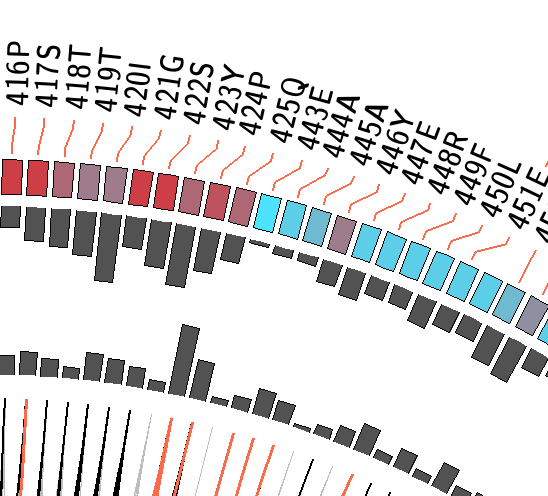 |  |
Contiguous positions in the MSA with information about conservation (red and blue rectangles),
cumulative MI (histogram facing outwards) and proximity MI (histogram facing inwards) |
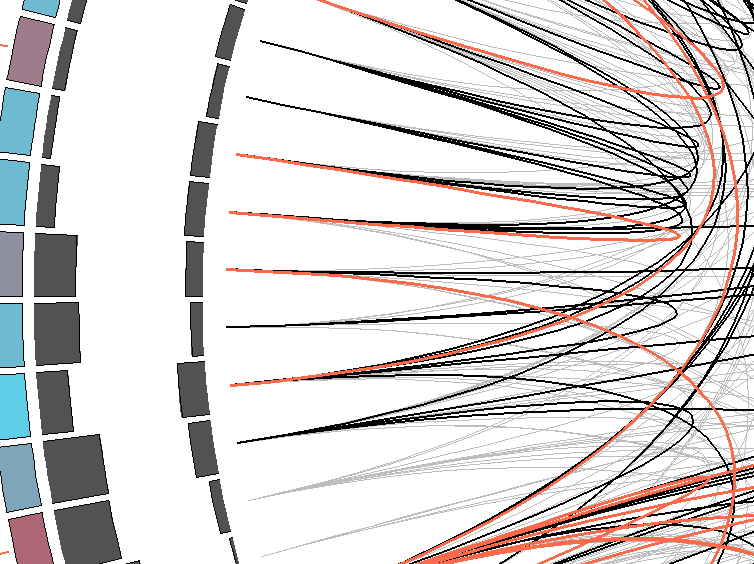
Mutual information relationship between MSA positions. Red edges represent the top 5% percentile, black ones are between 70% and 95%, and gray edges account for the 70% percentile . |
Glossary
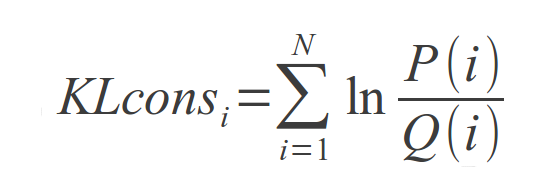
Conserved residues in protein families usually determine positions that play important biological or structural roles. Several metrics exist for measuring conservation in protein sequences. One of such, the Kullback-Leibler (KL) divergence, is used for such purpose in this web toolkit. For each column of the Multiple Sequence Alignment, the KL conservation is calculated as
where P(i) is the frequency of aparition of aminoacid i in that position and Q(i) is the background frequency of apparition for that aminoacid. This is computed for i=1..N with N=20, which is the standard aminoacid alphabet length.
Cumulative MI is calculated by adding the mutual information scores associated with its first neighbours. Each mutual information relationship between two positions is "absorbed" by both positions
equally, and added to its others MI relationships.
On the other hand, proximity MI is calculated by adding the cumulative MI (previously calculated) of positions that, when mapped to a structure, are
at less than 5 Å from it (considering the residue heavy atoms).